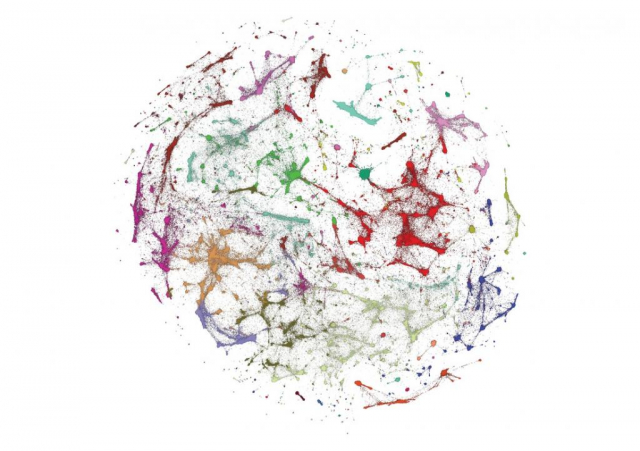
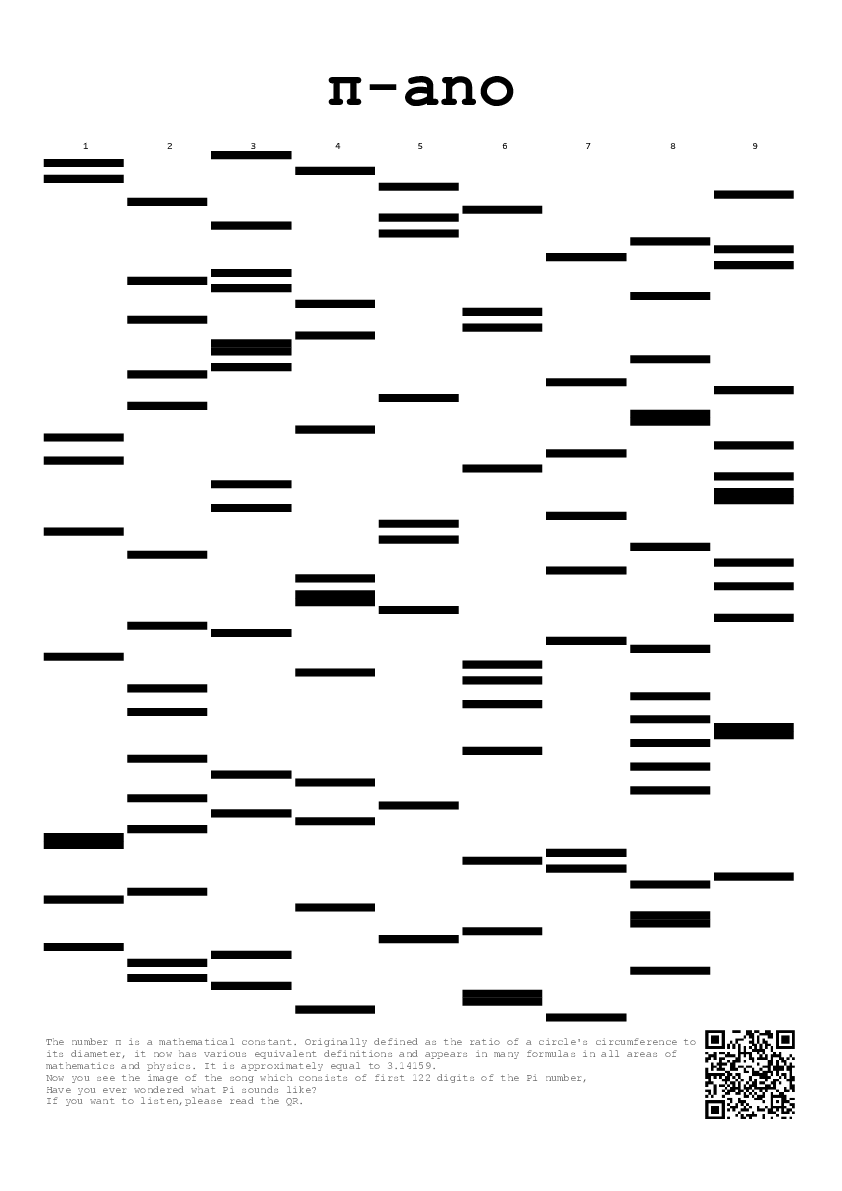
Data Stories is an exhibition of research visualizations on social and behavioural topics, coming from both academia and industry. The tenth edition brings together students, faculty, and business representatives to share their work and tools for data analysis and visualization. This project aims to improve collaboration in academia and enhance communication between students and future employers. It also aims to generate an open dialogue on social knowledge, technological interests, and technical skills.
Register for online attendance:
https://events.ceu.edu/2023-11-20/data-stories-ceu-10th-edition-exhibition-opening-and-roundtable


