Data stories 2025
Apply for the event
Program
Archive
Gallery
Speakers
Archive
Contact
Gallery
Print visualizations at Data Stories 2022
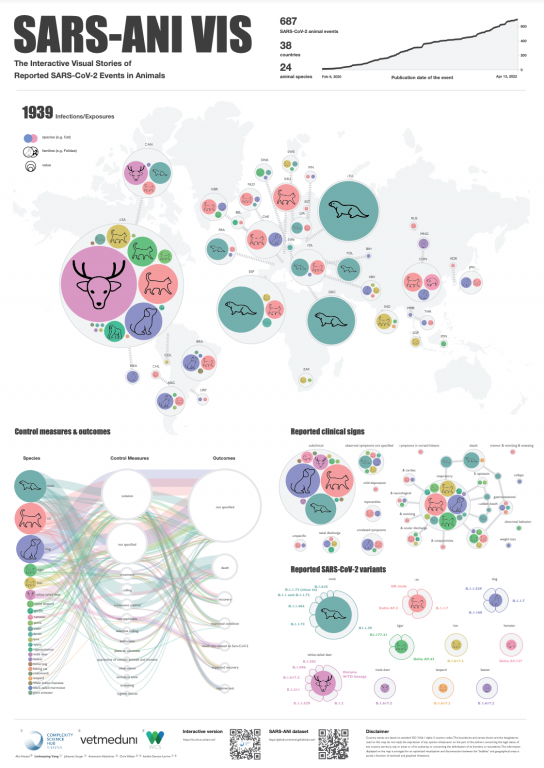
SARS-ANI Vis
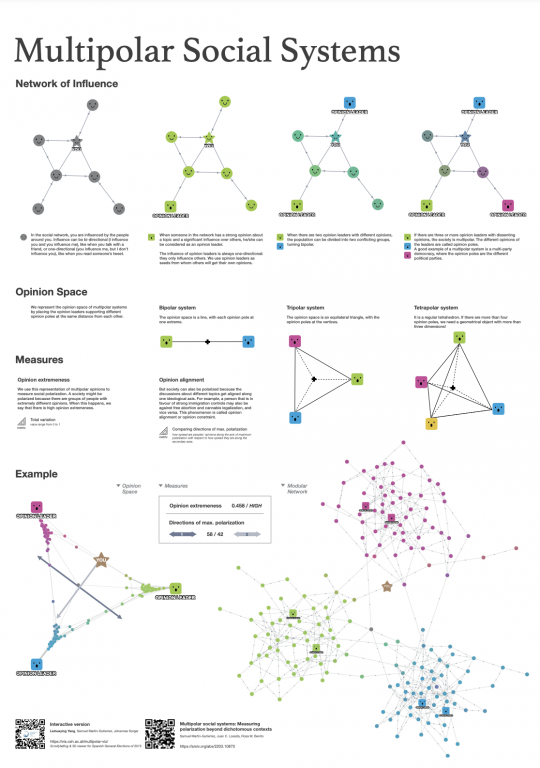
Multipolar Social Systems
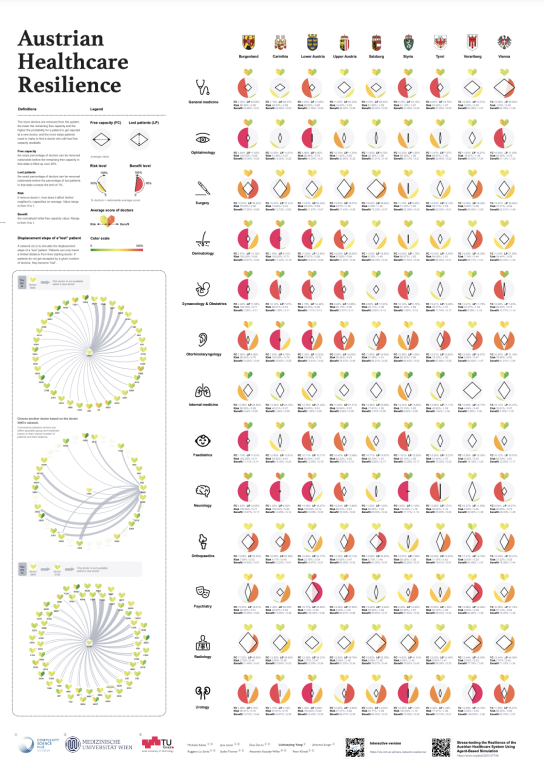
Austrian Healthcare Resilience
MONGOLIA: FOOD CONSUMPTION OF THE POPULATION
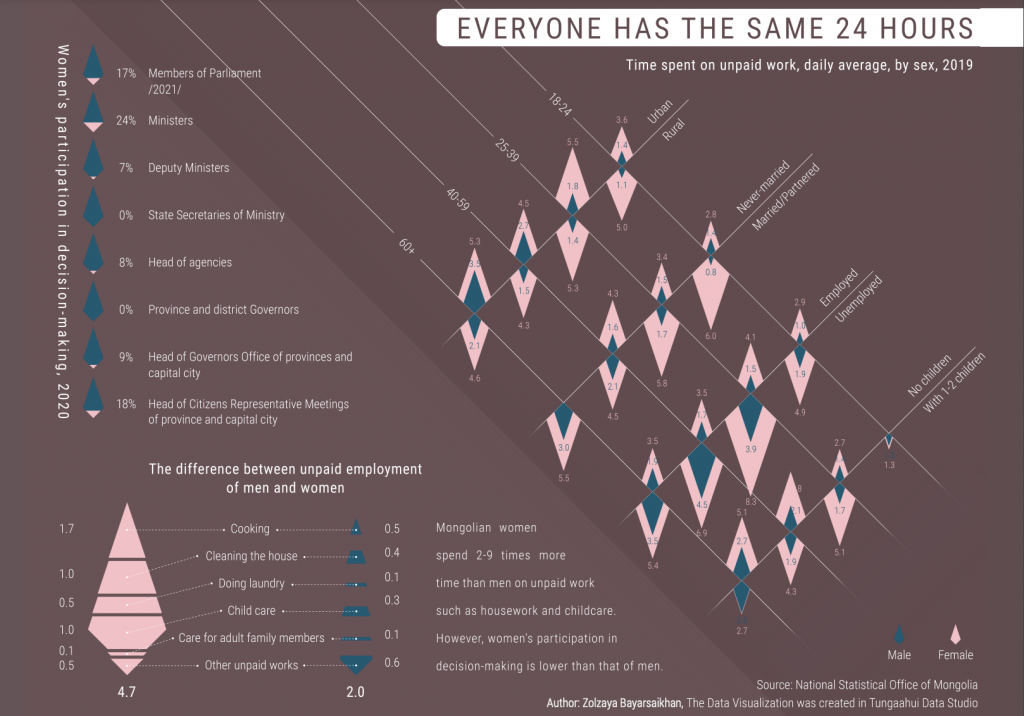
EVERYONE HAS THE SAME 24 HOURS
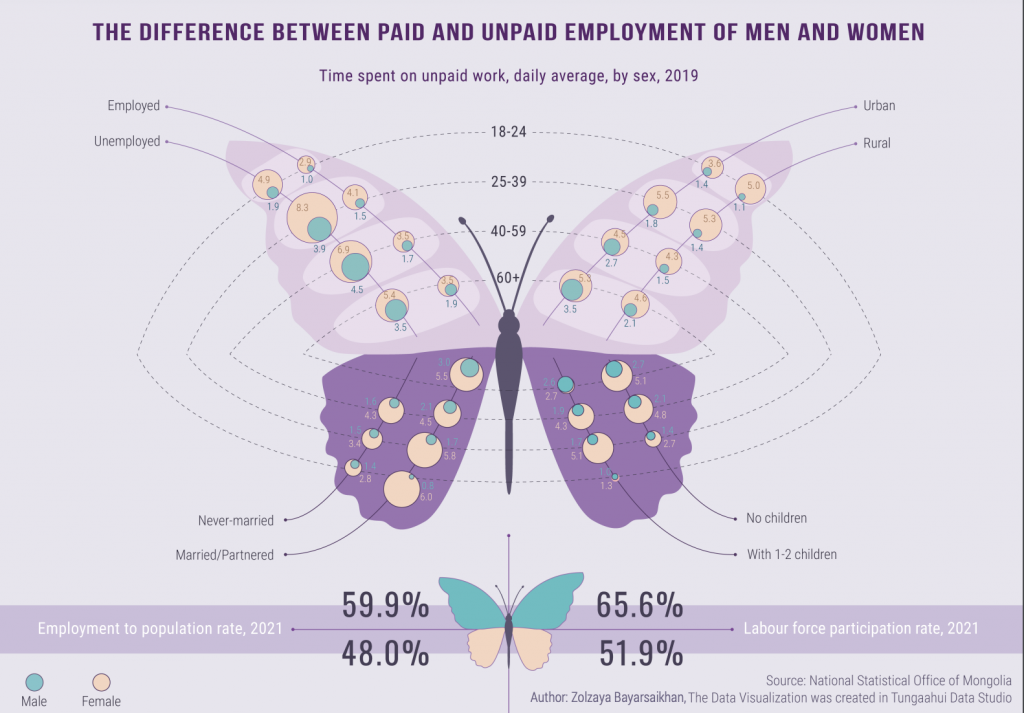
THE DIFFERENCE BETWEEN PAID AND UNPAID EMPLOYMENT OF THE MEN AND WOMEN
The temporal shape of pop music
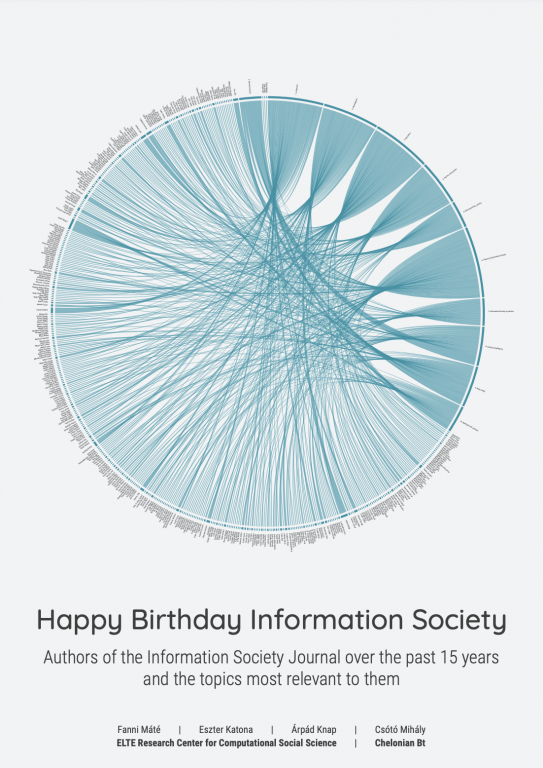
Happy Birthday Information Society
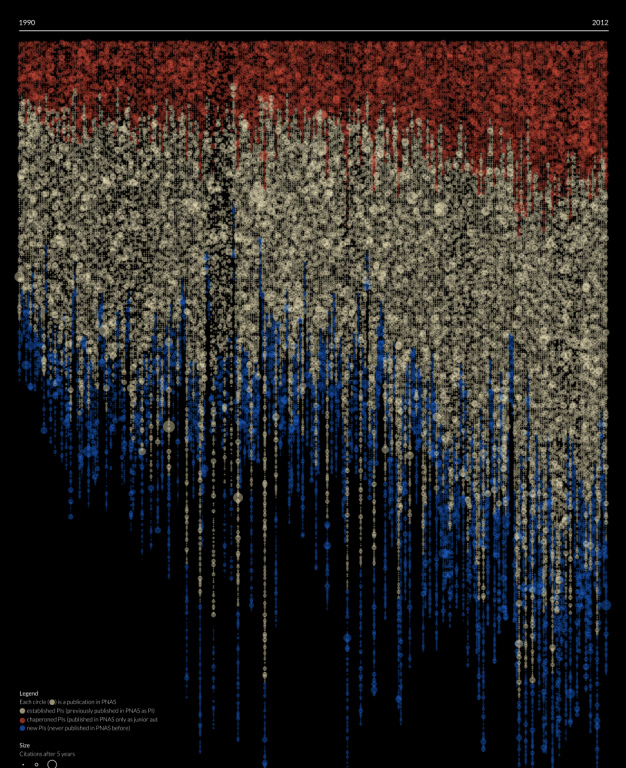
The Chaperone Effect in Scientific Publishing
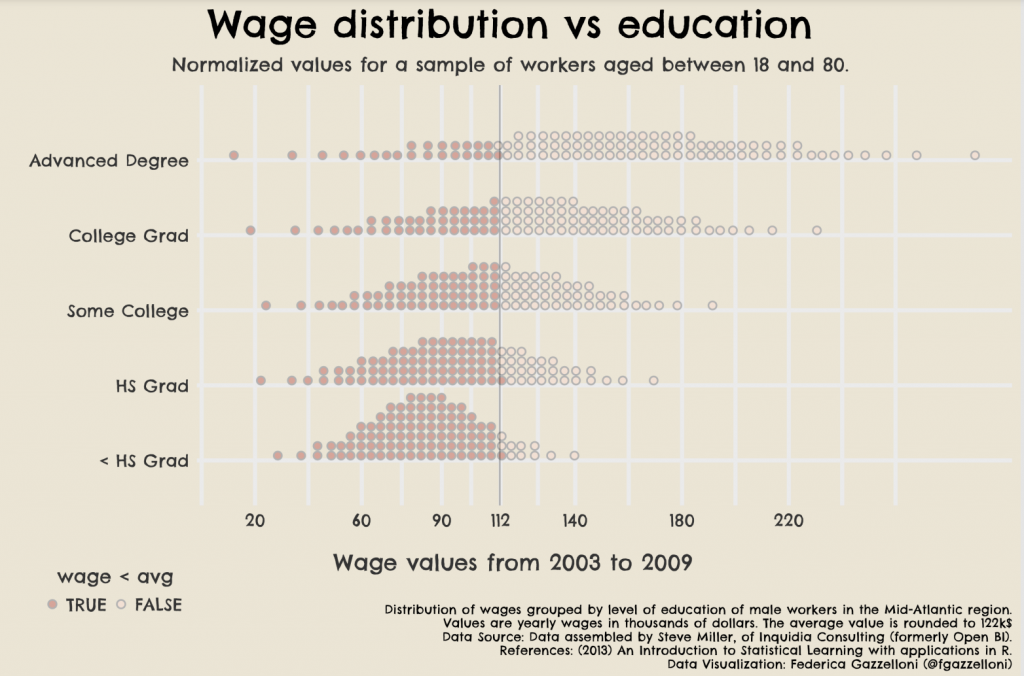
Wage distribution vs education
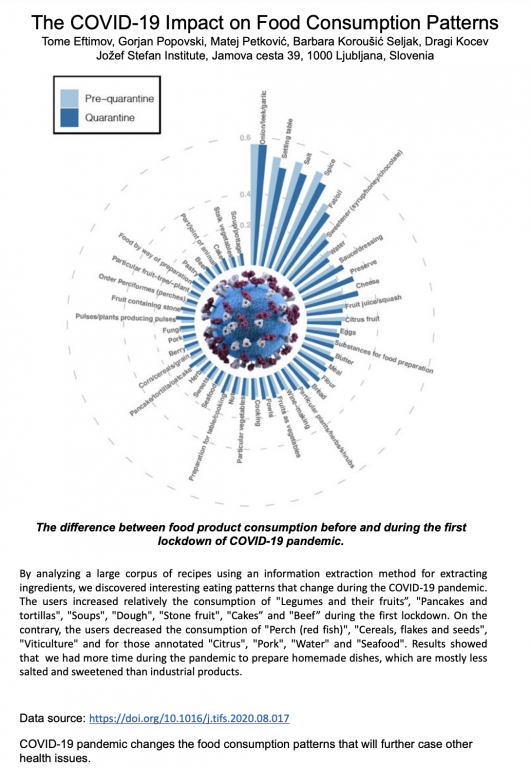
The COVID-19 Impact on Food Consumption Patterns
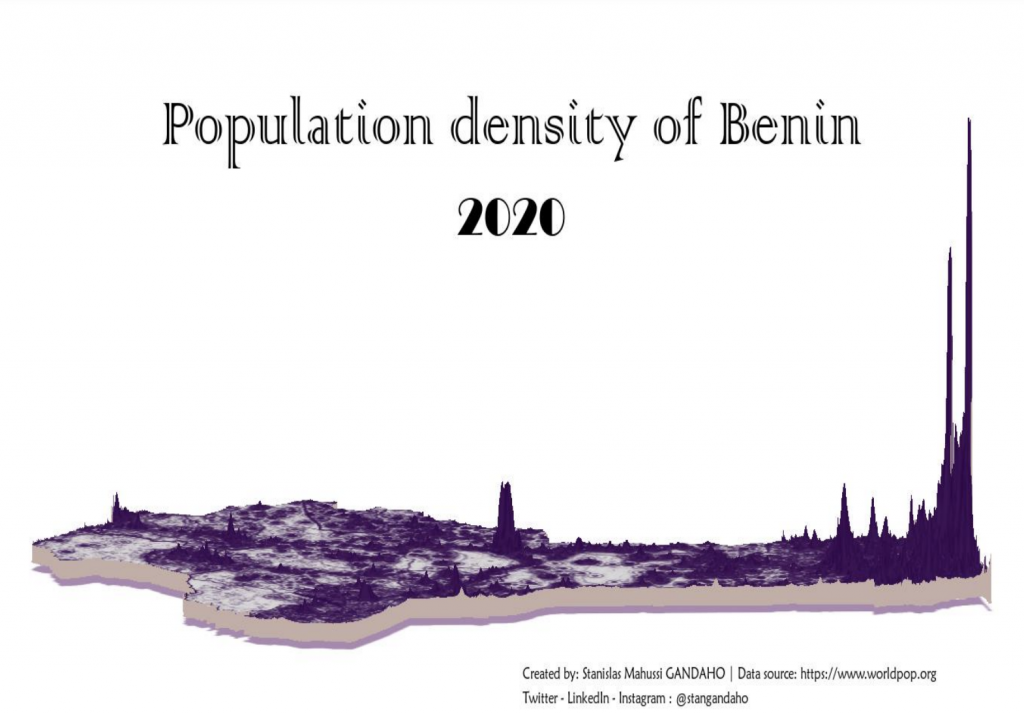
Population density map of Benin (Benin)
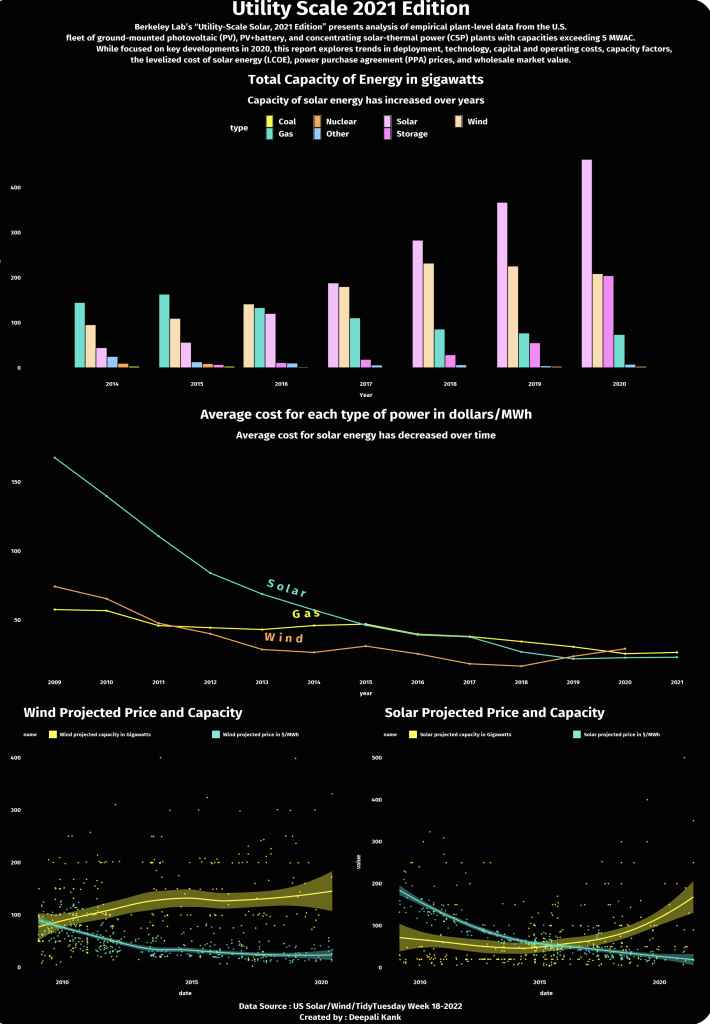
Utility Scale 2021 Edition
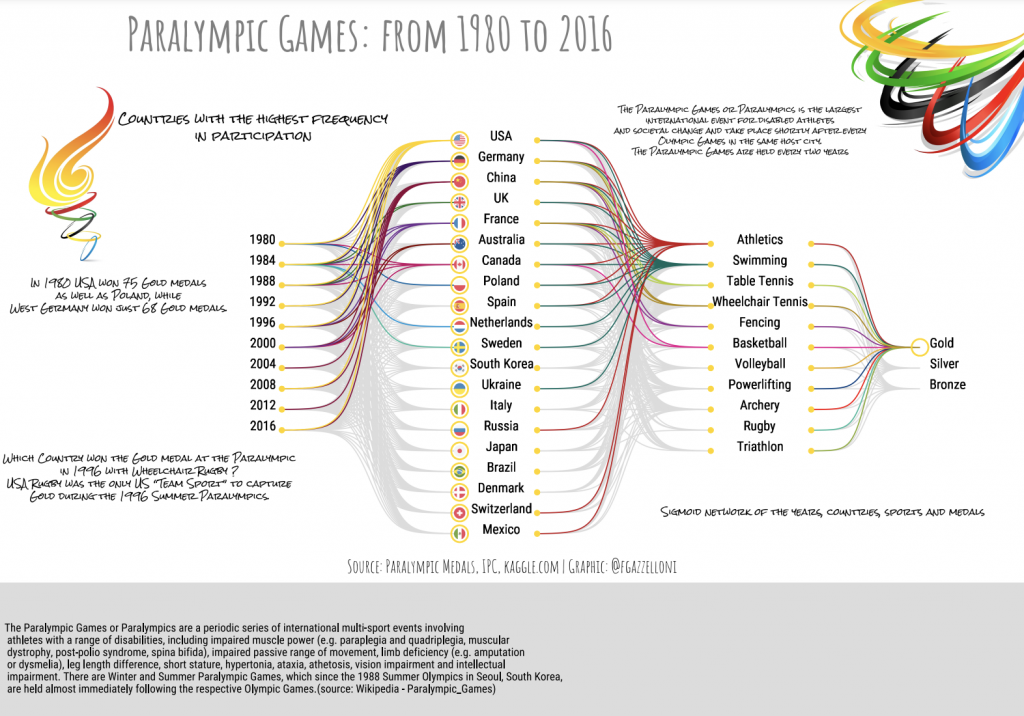
Paralympic Games: from 1980 to 2016
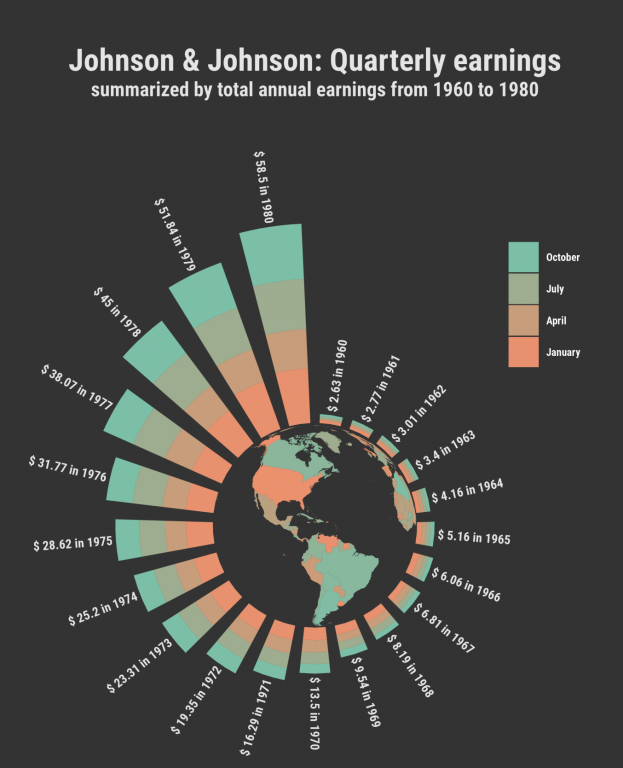
Johnson & Johnson: Quarterly earnings
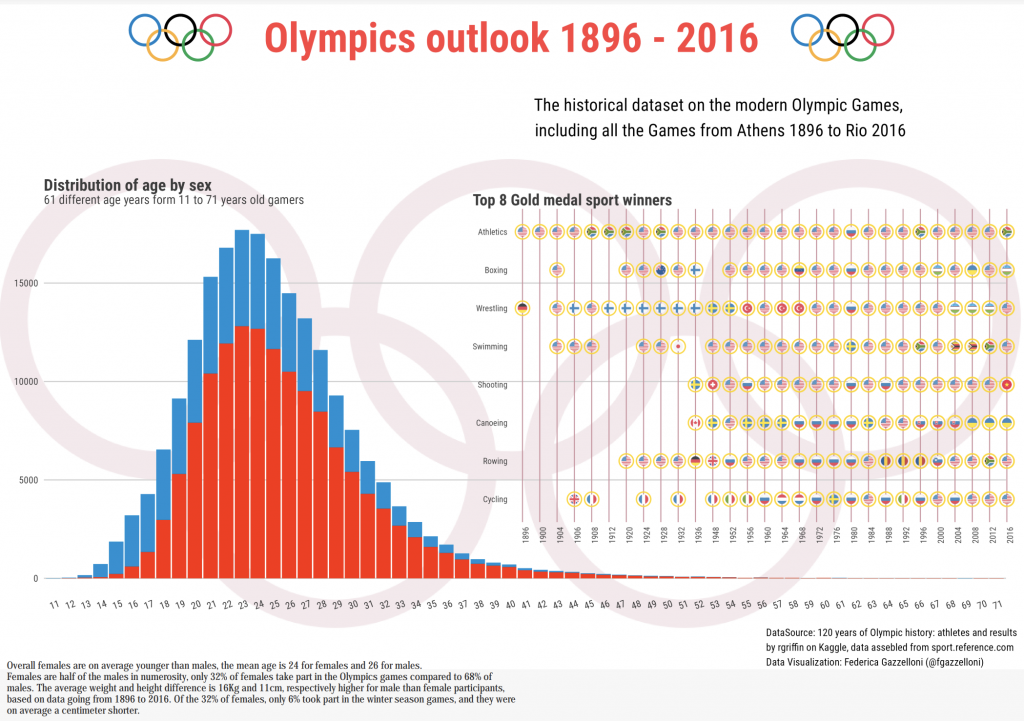
Olympics outlook 1896 – 2016
Tokyo Eat Map
WHEN DO THE MALLS OPEN? FROM A MOBILE NETWORK PERSPECTIVE
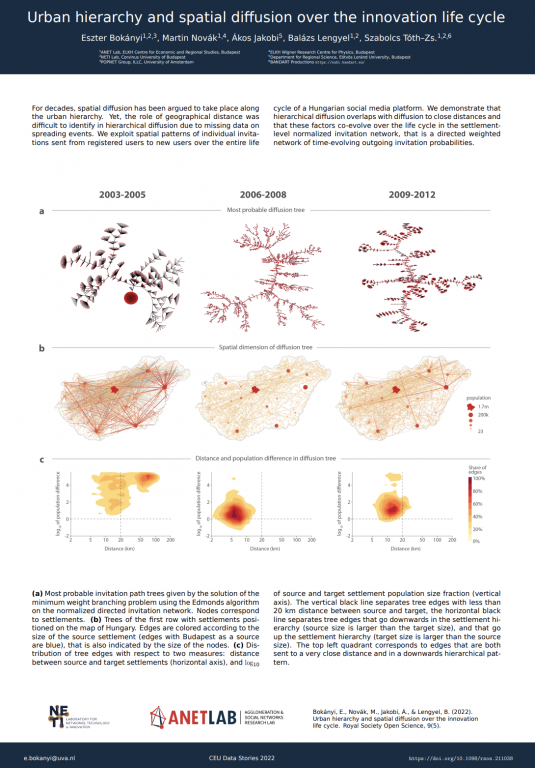
Urban hierarchy and spatial diffusion over the innovation life cycle
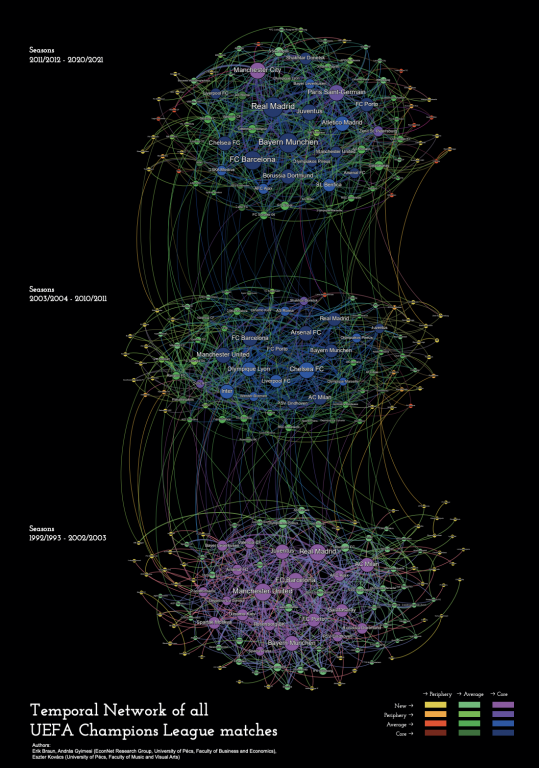
Temporal Network of all UEFA Champions League matches
NER METAVERSE: PRO-GOVERNMENT FACEBOOK PAGES
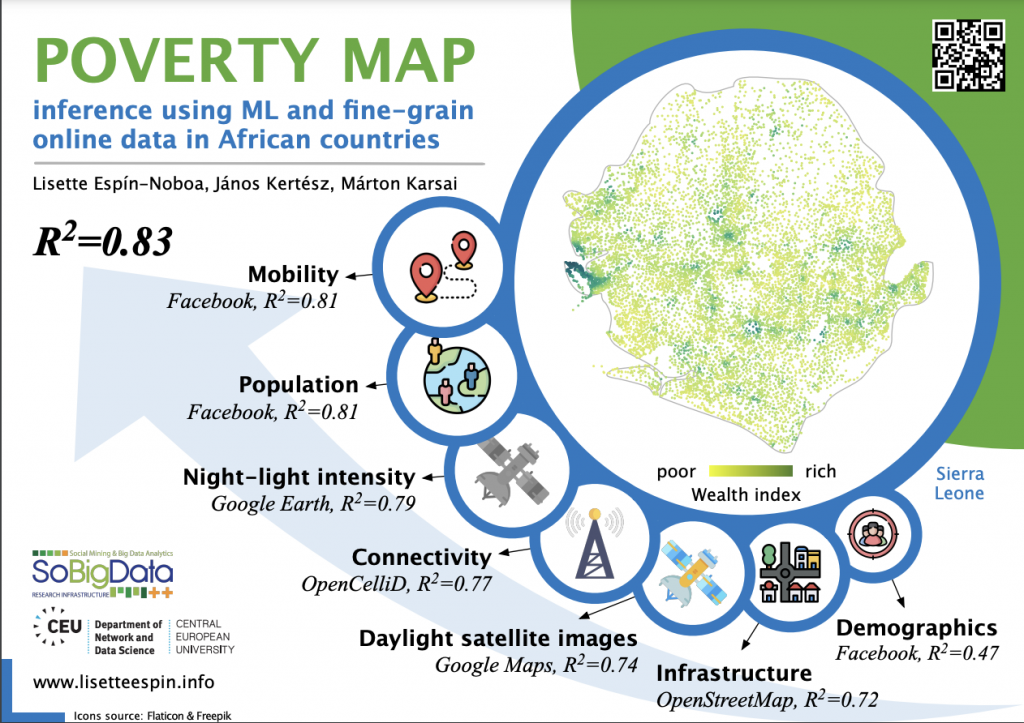
Poverty map inference using machine learning and fine-grain online data in African countries