Print Visualizations at Data Stories 2024

Population density map of Benin (Benin)

Author: Stanislas Mahussi GANDAHO

The plot realized is the population density map on Benin that shows how the population evolve throughout the Country. The dataset used is from worldpop that is estimated population density per grid-cell by Random Forest-based asymmetric redistribution mapping approach. The dataset is available to download (https://www.worldpop.org/geodata/summary?id=45947). The units are number of people per square kilometer based on country total adjusted to match the corresponding official United Nations population estimates that have been prepared by the Population Division of the Department of Economic and Social Affairs of the United Nations Secretariat (2019 Revision of World Population Prospects).

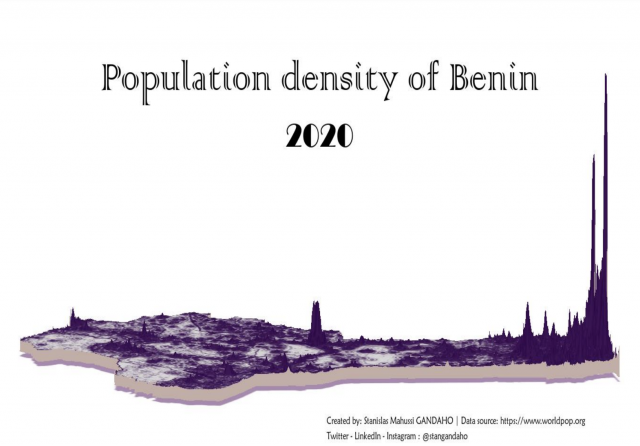
The 3D population density shows us there are an intensive population density in south Benin (Abomey-Calavi and Cotonou town). At north-south, there are Parakou city that has a population density relatively high. The same remark is made at north extreme of Benin (Malenville city).

This visualization was made in R using mainly raster, rasyhader and magick package.