Print Visualizations at Data Stories 2025
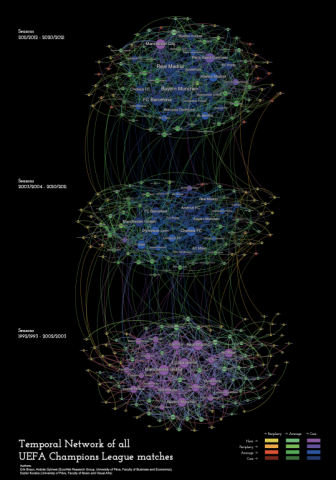
Temporal Network of all UEFA Champions League matches
Author:
András Gyimesi
Erik Braun
Eszter Kovács
The visualization displays a multilayer temporal network of the UEFA Champions League (CL), where the nodes are the teams and the edges represent the number of CL matches between them. Data of the pairings were collected from elofootball.com. The three temporal layers show three distinct eras: (1) the 90s when initially only champions could qualify, (2) the 2000s when the 32-team group stage format was introduced, and (3) the 2010s when the prize pool started to drastically increase and the Financial Fair Play regulations were introduced. The aim of this project is to capture the evolution of the core-periphery structure. For the international audience, the most well-known teams are those who play more often, so we treated the 20 largest-degree teams as core, while those who qualified only once as periphery teams. The network representation of the temporal dynamics reveals that the group of core teams evolving slowly, with only a few suddenly emerging teams like Manchester City and Paris Saint-Germain in the 2010s in favor of dropping teams like AC Milan. The strongest connections are between core teams that often got paired with each other after completing the group stage, which can lead to some emerging rivalries. Studying these core-core connections is important, as they contribute to the global attractiveness of the tournament. By visualizing the temporal dynamics we can track each team’s route to global fame or fade into obscurity.