Print Visualizations at Data Stories 2026
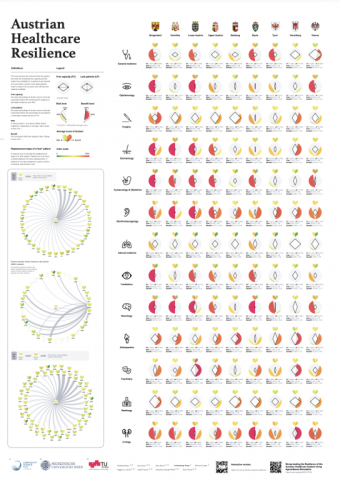
Austrian Healthcare Resilience
Author:
Michaela Kaleta
Jana Lasser
Liuhuaying Yang
Johannes Sorger
Patients do not access physicians at random but rather via naturally emerging networks of patient flows between them. As retirements, mass quarantines and absence due to sickness during pandemics, or other shocks thin out these networks, the system might be pushed closer to a tipping point where it loses its ability to deliver care to the population. This visualization is derived from the interactive visualization dashboard created for exploring the resilience indicators of the Austrian Healthcare system that was proposed in a research project involving the Complexity Science Hub Vienna, Medical University of Vienna and Graz University of Technology. This research proposed a data-driven framework to quantify regional resilience in Austria via an agent-based simulation model. In this model, for each region and medical specialty, a detailed patient-sharing network is constructed from administrative data. These networks are then stress-tested by removing an increasing number of physicians from the system. The regional resilience indicators describe how many physicians can be removed from a certain area before individual patients cannot be treated anymore. Using the aggregated simulation data and the network structure of physicians within the healthcare system, this visualization shows the state- and specialty-specific information on resilience indicators.