Print Visualizations at Data Stories 2025
Author: Matteo Bohm, Daniele Fadda, Mirco Nanni & Luca Pappalardo
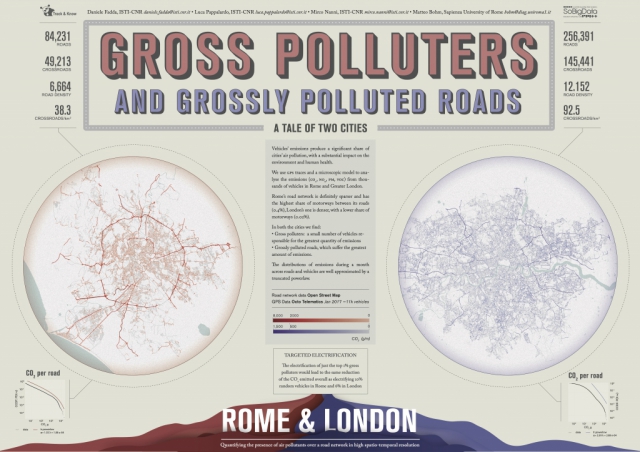
Vehicles’ emissions produce a significant share of cities’ air pollution, with a substantial impact on the environment and human health. We use GPS traces and a microscopic model to analyse the emissions (CO2, NOx, PM, VOC) from thousands of vehicles in Rome and Greater London.Rome’s road network is definitely sparser and has the highest share of motorways between its roads (0.4%), London’s one is denser, with a lower share of motorways (0.02%).
In both the cities we find: gross polluters, which are vehicles responsible for the greatest quantity of emissions, and grossly polluted roads, which suffer the greatest amount of emissions.
The distributions of emissions during a month across the roads of the two cities is well approximated by a truncated powerlaw (shown in the two little plots at the bottom left and right sides). The two maps show the quantity of CO2 emitted in the roads of the two cities during the month of January 2017, normalized by the length of each road.