Print Visualizations at Data Stories 2025
Author: Levente Simon
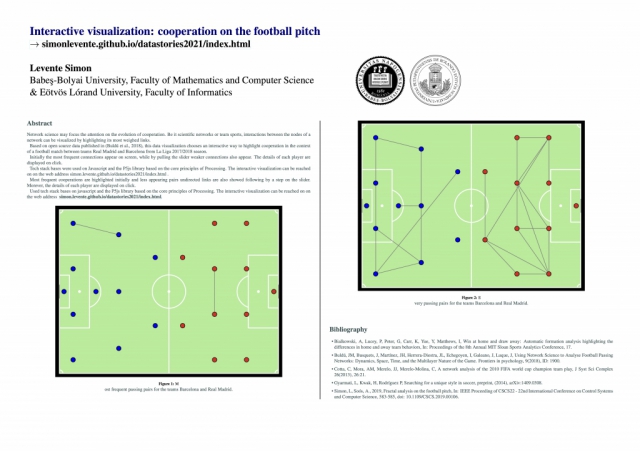
Network science may focus the attention on the evolution of cooperation. Beit scientific networks or team sports, interactions between the nodes of a network can be visualized by highlighting its most weighed links.
Based on open source data published in (Buldú et al., 2018), this data visualization chooses an interactive way to highlight cooperation in the context of a football match between teams Real Madrid and Barcelona during the La Liga championship of season 2017/2018.
Initially the most frequent connections appear on screen, while by pulling the slider weaker connections also appear. The details of each player are displayed on click.
Tech stack bases were used on Javascript and the P5js library based on the core principles of Processing. The interactive visualization can be reached on on the web address simon.levente.github.io/datastories2021/index.html .
• Buldú, JM, Busquets, J, Martinez, JH, Herrera-Diestra, JL, Echegoyen, I, Galeano, J, Luque, J, Using Network Science to Analyse Football Passing Networks: Dynamics, Space, Time, and the Multilayer Nature of the Game. Frontiers in psychology, 9(2018), ID: 1900.
• Gyarmati, L, Kwak, H, Rodriguez P, Searching for a unique style in soccer, preprint, (2014), arXiv:1409.0308.
• Simon, L, Soós, A., 2019, Fractal analysis on the football pitch, In: IEEE Proceeding of CSCS22 - 22nd International Conference on Control Systems and Computer Science, 583-585, doi: 10.1109/CSCS.2019.00106.