Print Visualizations at Data Stories 2025

Author: Dénes Csala
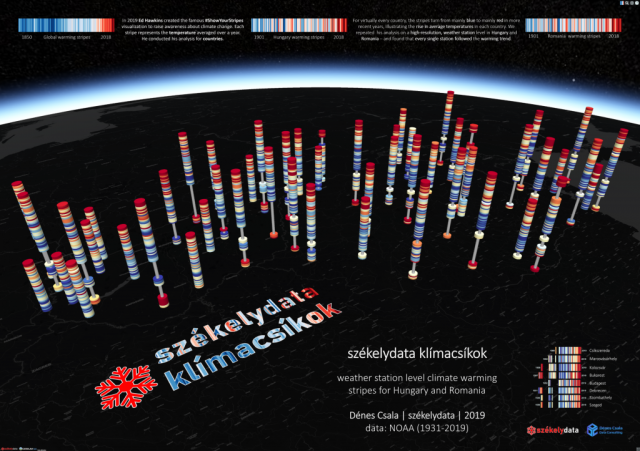
- Data source: NOAA historical weather data (1931-2019)- Description: In 2019 Ed Hawkins created the famous #ShowYourStripes visualization to raise awareness about climate change. Each stripe represents the temperature averaged over a year. He conducted his analysis for countries. For virtually every country, the stripes turn from mainly blue to mainly red in more recent years, illustrating the rise in average temperatures in each country. We repeated his analysis on a high-resolution, weather station level in Hungary and Romania – and found that every single station followed the warming trend. In 3D, each year is represented by a colored disc. Likewise, instead of warming stripes, we get warming “towers”, located at the coordinates of each weather station. The top of the tower is the latest available year (usually 2019) and blank disc slots are years with missing data. The data was formatted in python and tools used were D3.js and Cesium.js. Try the interactive version, too, at: https://szekelydata.csaladen.es/klima
- Message: We constructed warming towers out of Ed Hawkins’s warming stripes in order to illustrate the extend of climate change in Hungary and Romania. We found that every single weather station followed the warming trend!
