Print Visualizations at Data Stories 2025

Author: Bence Kiss-Dobronyi
Co-author: David MihalyiKey message: Global estimates of the aggregate economic impacts of climate change mask a reality of dramatic individual losses and ballooning inequalities.
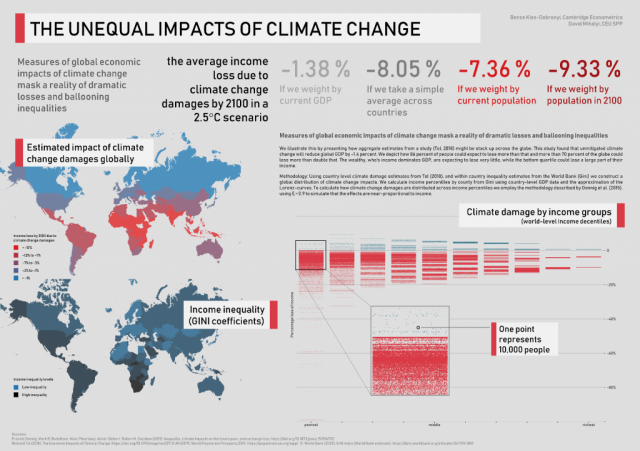
We illustrate this by presenting how one such recent estimates from a meta-study (Tol, 2018) might add up if we break it down across and within countries. This study found that a 2.5 degree warming will reduce global GDP by 1.38 percent. Our disaggregation and visualization reveals how the vast majority of the global population can expect to lose more than that. While, the wealthy - who's income dominates GDP - are expected to lose very little, many among the poorest are expected to lose over 10X that figure.
Methodology: Using country level climate damage estimates from Tol (2018), and within country inequality estimates from the World Bank (Gini) we construct a global distribution of climate change impacts. We calculate income percentiles by county from Gini using country-level GDP data and the approximation of the Lorenz-curves. To calculate how climate change damages are distributed across income percentiles we employ the methodology described by Dennig et al. (2015), using ξ = 0.9 to simulate that the effects are near-proportional to income.
Data sources:
- Richard Tol (2018): The Economic Impacts of Climate Change, https://doi.org/10.1093/reep/rex027
- Francis Dennig, Mark B. Budolfson, Marc Fleurbaey, Asher Siebert, Robert H. Socolow (2015): Inequality, climate impacts on the future poor, and carbon prices, https://doi.org/10.1073/pnas.1513967112
- UN (2019): World Population Prospects 2019, https://population.un.org/wpp/
- World Bank (2020): GINI Index (World Bank estimate), https://data.worldbank.org/indicator/SI.POV.GINI
