Print Visualizations at Data Stories 2025
Author:
Federica Gazzelloni
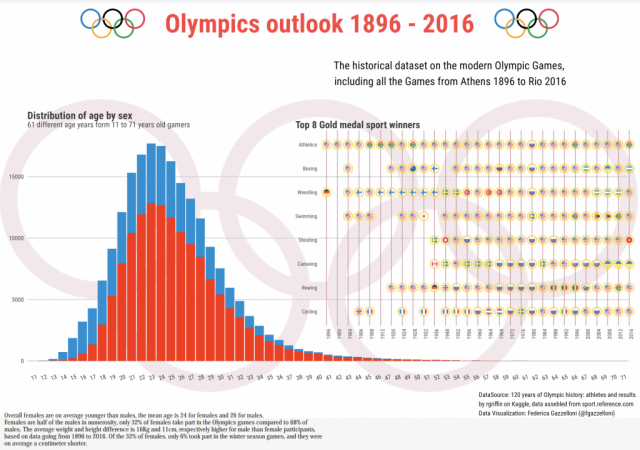
The plot is made with RStudio. In particular, the gender gap is a barplot with different colors by gender, while the abacus of the sports by country is obtained with the geom_flag() function from the {ggflag} package with the evidence of the vertical grid for each year.
The historical dataset on the modern Olympic Games includes all the Games from Athens 1896 to Rio 2016.
Overall, females are on average younger than males, the mean age is 24 for females and 26 for males. Females are half of the males in numerosity, only 32% of females take part in the Olympics games compared to 68% of males. The average weight and height difference is 16Kg and 11cm, respectively higher for male than female participants, based on data going from 1896 to 2016.
Of the 32% of females, only 6% took part in the winter season games, and they were on average a centimeter shorter.
DataSource: 120 years of Olympic history: athletes and results by rgriffin on Kaggle, data assembled from sport.reference.com
Data Visualization: Federica Gazzelloni (@fgazzelloni)
The graph was posted originally on Twitter as part of the #TidyTuesday 2021 week 31 competition.

