Print Visualizations at Data Stories 2025
Author:
Julian Hoffmann Anton
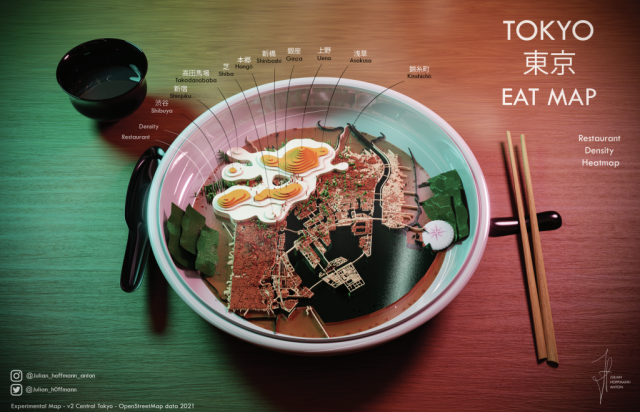
It represents the density of restaurants in central Tokyo on a map, morphed into a typical Japanese ramen dish. It is a mix of a heatmap, density map and contour visualization, embellished with artistic liberties.
I see it as an simple story of finding the right ramen restaurant within Tokyo’s culinary hotspots, and dreaming the delicious dish as map or vice versa, the map as a dish.
The data is freely available from OpenStreetMap’s points of interest, specifically places labelled as “Restaurant”.
The first version which I have been enriching since, was made as part of an online creative mapping challenge: 30DayMapChallenge. All made with open-source programmatical GIS tools in R, then modelled in Blender, an open-source 3D visual effects software and finally edited and labelled in Photoshop for the final touch.